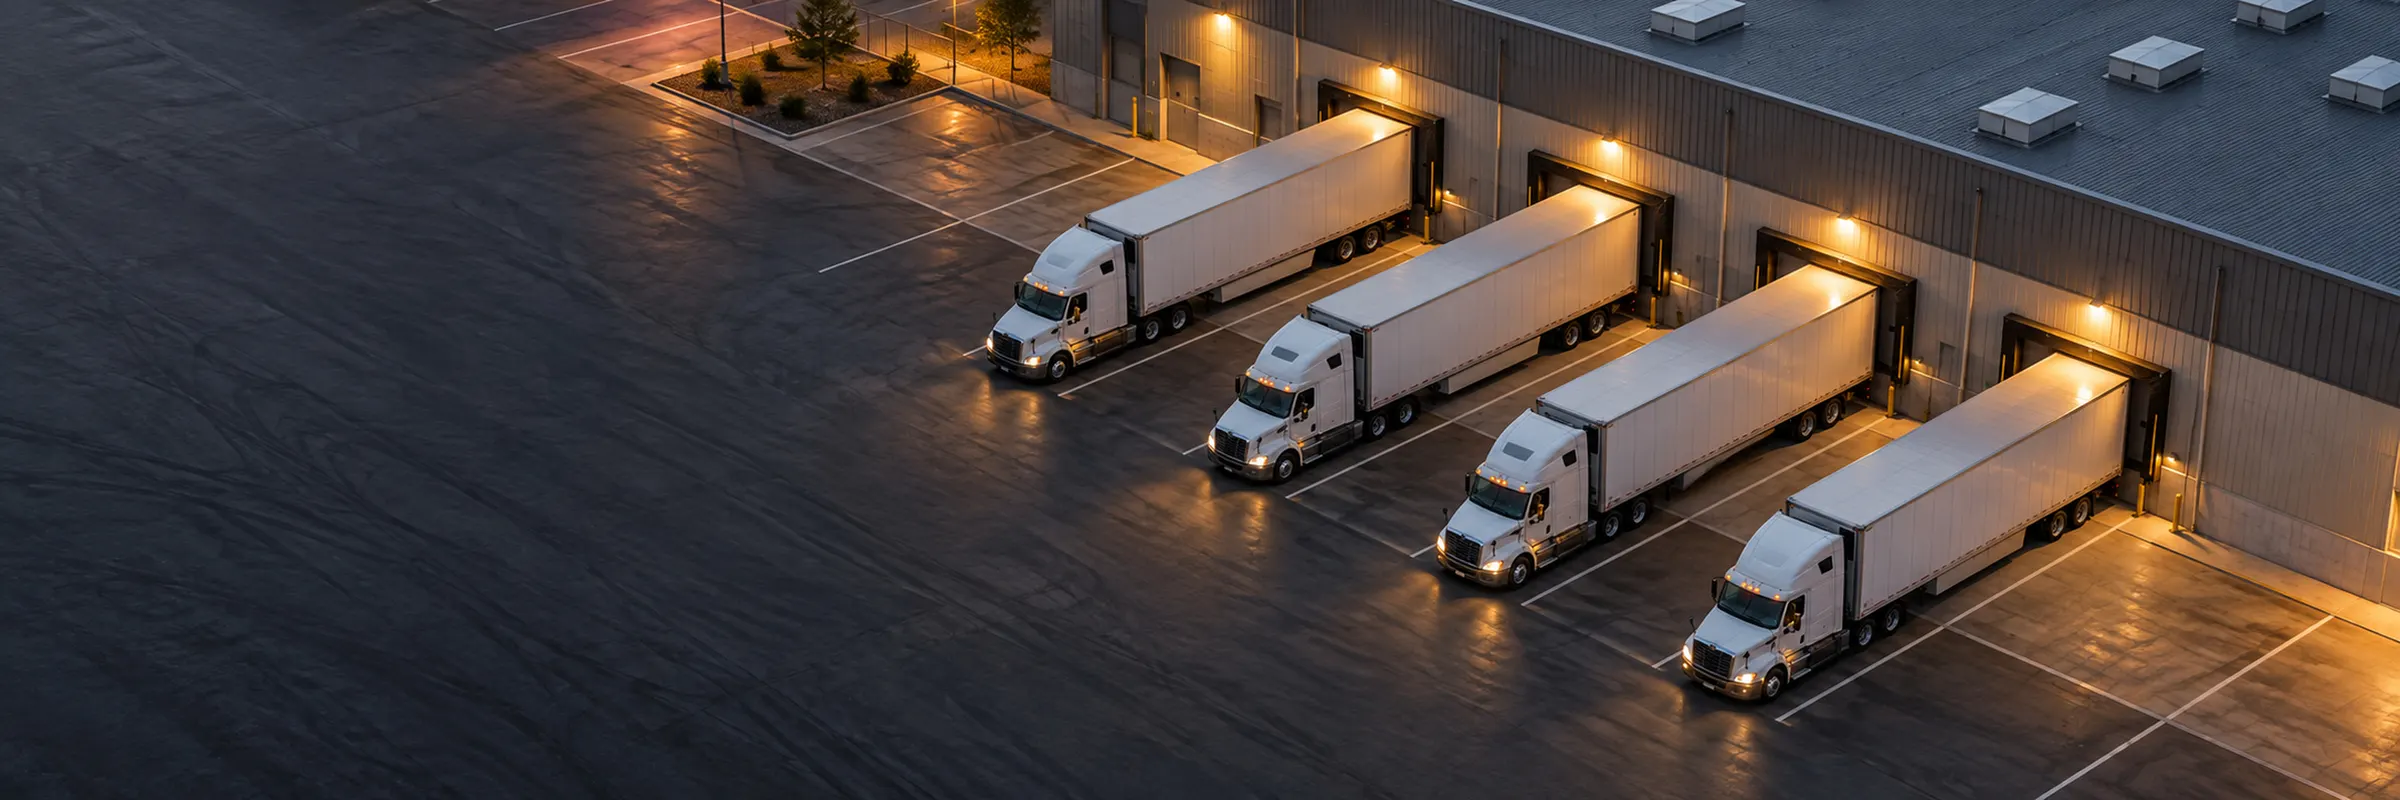
3D warehouse & process models
Represent storage, docks, work areas, routes and process dependencies at the level needed for the decision. Use visualization to check operating assumptions with the floor team.
Evaluate how warehouse layouts, resources and operating rules perform under different conditions.
You need to compare layouts, staffing levels or automation options under normal and peak demand before committing resources. We agree the operating requirements, input data and decision criteria before developing recommendations.
On site in Hyderabad, across Telangana and India. All our services in Hyderabad →
02 / Digital simulation
Compare movement, resource constraints and demand scenarios before committing to physical changes.
ILLUSTRATIVE SIMULATION — NOT CLIENT DATA
F1 collects received pallets and puts them into reserve storage. F2 takes available stock from storage to replenish the supermarket. P1 walks through three supermarket bays, builds a cart and passes it to the production line. Trucks wait at holding points while the single-width storage aisle is occupied; no overtaking during putaway or retrieval.
F1 · Putaway: Waiting for received pallet · Empty · 0s waiting
F2 · Replenishment: Waiting for stored pallet · Empty · 0s waiting
P1 · Line picking: Waiting for line kit · Empty · 0/3 bays picked
For decisions involving AGVs, AMRs, conveyors or automated storage, explore equipment constraints and interfaces alongside the wider warehouse model.
Selected robot 1: idle · task none · 0s to next phase · area receiving
Two transport resources use their marked pickup/drop-off ports and color-matched lanes, with one FIFO task queue. Each task follows pickup → loaded travel → drop-off → empty return. A transfer completes after drop-off. Utilization includes empty return. The drawing shows storage-buffer pickup → picking handover → separate empty-return lanes. Loaded and empty paths stay in the clear corridor. Selected work areas are annotations and do not change this transport-only scenario.
Arrivals every 14s; pickup 6s; travel 18s; drop-off 4s; return 12s. Manual/AMR differences are assumed input timings, not measured or inherent technology advantages. No traffic interaction, safety validation, battery/charging, shared docking, variability or faults are modeled.
Scenario changes reset the model. Playback never autostarts and pauses offscreen or in hidden tabs. This is not a validated capacity model or commercial AMR fleet simulator.
Feasibility & business case
Change the estimated operating assumptions. Add your own cost assumptions to evaluate a simple, undiscounted payback.
Supply hourly labor cost, positive installed investment, annual operating cost and a non-zero cost-realization percentage. Released time alone is not cash savings.
Technology explorer
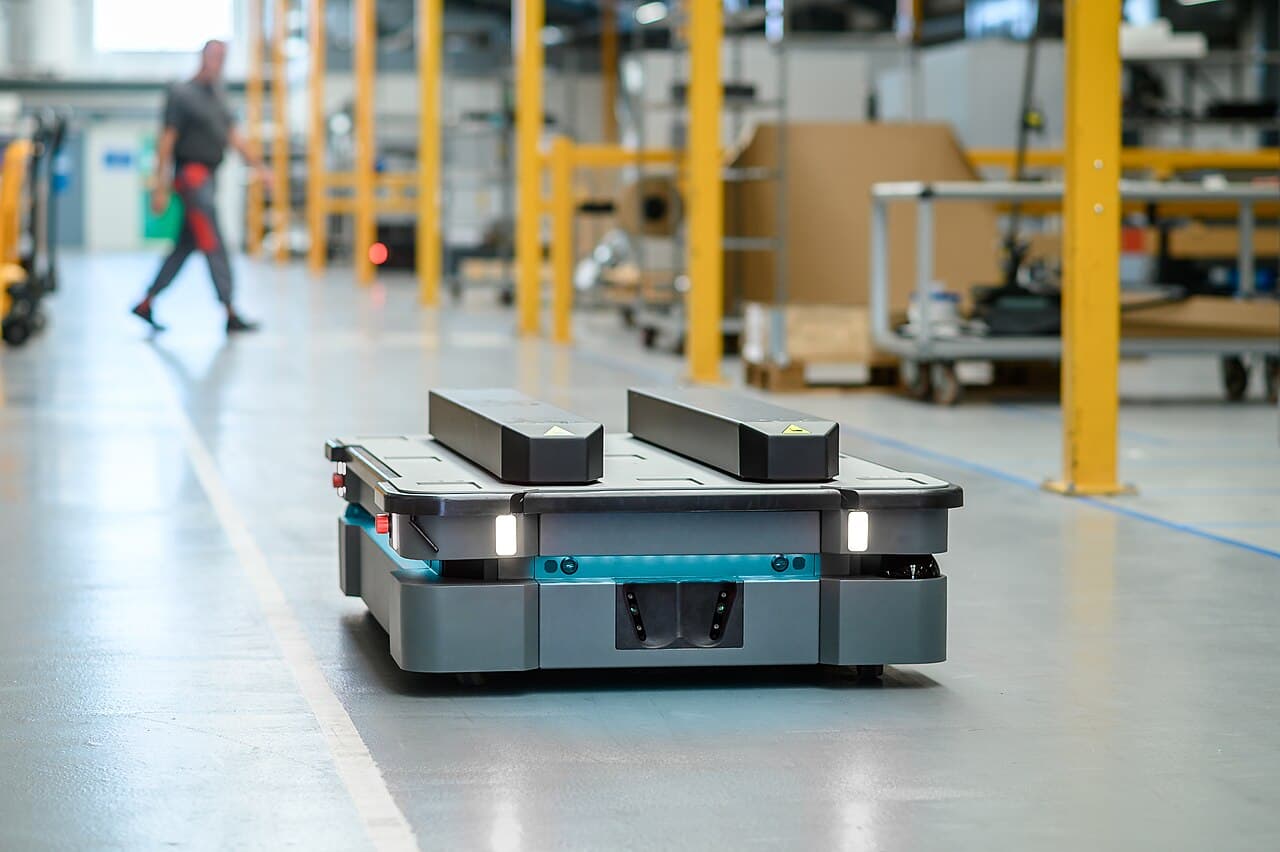
Representative equipment photographs · not TvastrOps installations · no vendor endorsement or compatibility claim
Systems integration architecture
Work requests flow toward execution; acknowledgements, exceptions and completion confirmations return to their owners.
Function
Owns business orders, inventory and authorized work release.
Example data exchanged
Order/task identity, SKU, quantity, locations and completion status.
Dependencies
Agreed source of truth, location master and idempotent transaction ownership.
Failure considerations
Duplicate, delayed or canceled work must not create duplicate stock movements.
Conceptual responsibility model, not a prescribed software stack. Interfaces and safety controls require supplier-specific engineering and verification; business software is not a safety control.
Service overview
We model process and material flow in AnyLogic (discrete-event simulation of arrivals, queues, routes and resources) and robots and automation in NVIDIA Isaac Sim (physics-based 3D simulation of AMR fleets, robotic picking and conveyors inside a digital twin of the building), depending on the question and available data. It is checked against observed behavior where a baseline exists. Inputs, sensitivities and limitations accompany the findings; a visual model alone is not evidence of validated capacity or a live connected digital twin.
We build decision-specific warehouse models to examine how arrivals, tasks, routes, queues and resources interact. The purpose is to compare operating alternatives on a common demand profile before committing space, staffing or capital.
Physical layouts and rack planning are covered by Warehouse Layout DesignB2 / Scope of work
We agree the areas, data requirements and deliverables during scoping. The activities below define the service’s technical focus.
Represent storage, docks, work areas, routes and process dependencies at the level needed for the decision. Use visualization to check operating assumptions with the floor team.
Model arrival patterns, task release, queues, handling and resource availability in AnyLogic. Define event rules and exceptions rather than assuming continuous, unconstrained movement.
Compare completed work, waiting and workforce or equipment occupancy across demand and resource plans. Separate model outputs from measured operational results.
Where automation is on the table, test AMR and AGV fleets, robotic picking and conveyors in NVIDIA Isaac Sim: a physics-based 3D digital twin of your warehouse with simulated robots and sensors, run against your layout and order profile before you buy. Supplier interfaces and the supplier's own validation are defined for each application.
SIM-02 / Technical explanation
Trace forklift, picker and transport routes, loaded and empty movement, handovers and travel distance. State route geometry, speed and handling-time assumptions.
SIM-03 / Technical explanation
Test alternative layouts, staffing levels, peak arrivals and operating rules. Identify queue locations, shared-aisle constraints and bottlenecks, and assess sensitivity to uncertain inputs.
Technical approach
Floor observation and operating data establish the basis; review and verification close the loop.
Agree alternatives, performance measures, model boundary and the evidence needed to change the decision.
Observe task times and routes; review demand, staffing and equipment data. Record missing inputs and assumptions.
Check model logic and baseline behavior, then compare alternatives on the same demand and measurement basis.
Issue findings, sensitivities and limitations. Define a pilot and compare live observations with modeled expectations.
Applications
Typical operating situations; these are not client case studies.
Engineering deliverables
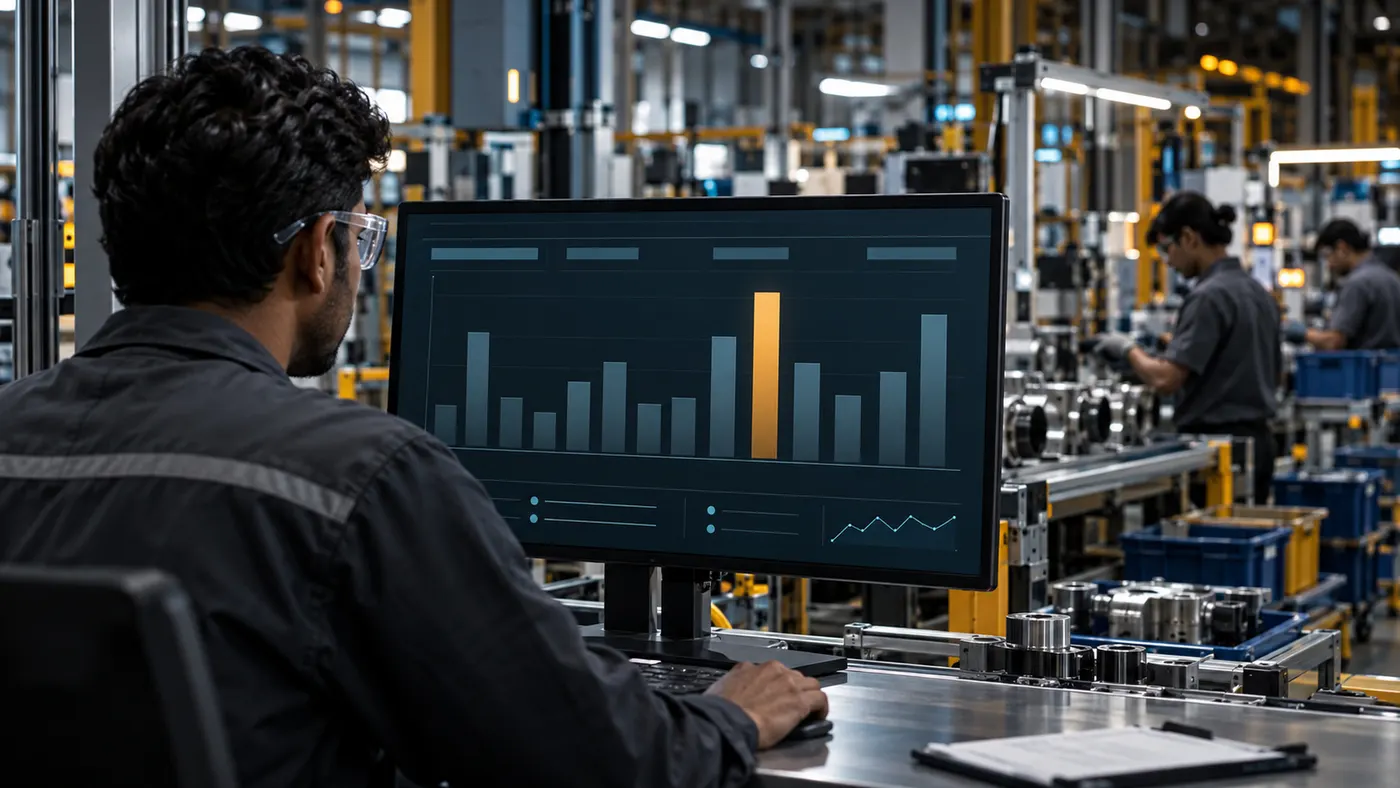
The decision being tested, the scenarios that could change it and the input data each one depends on.
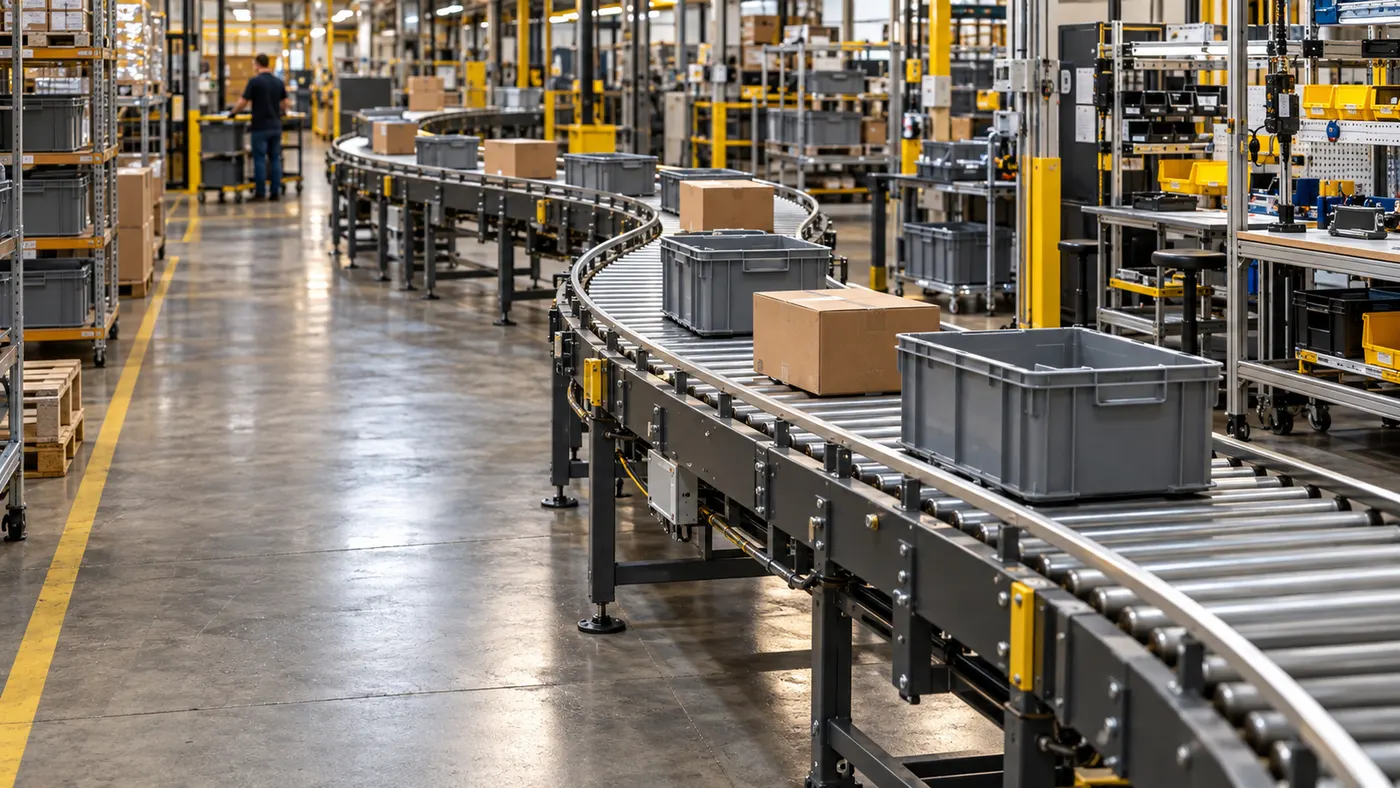
Throughput, waiting, resource utilization and congestion compared across scenarios on the same demand.
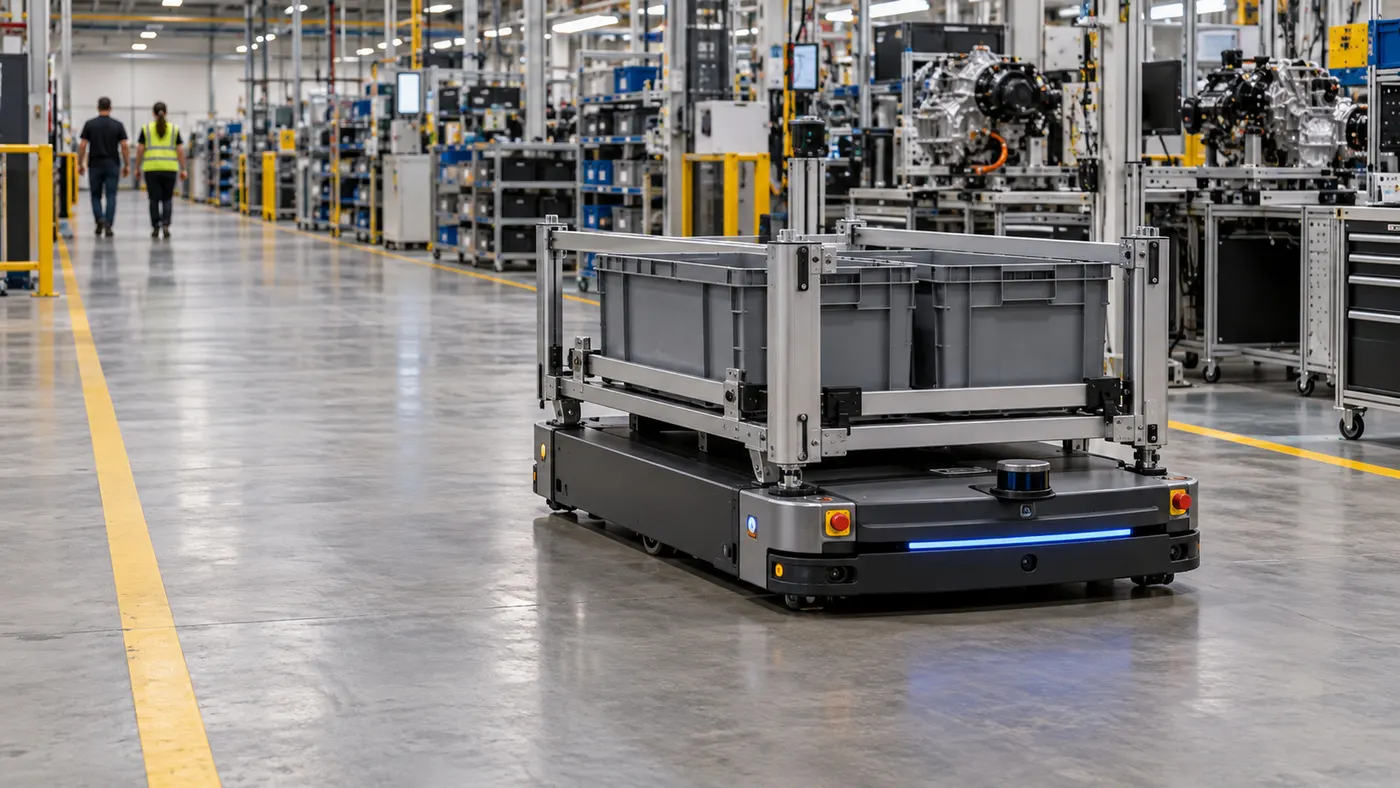
Where robotics or automation fits the observed work, and the assumptions behind that view.
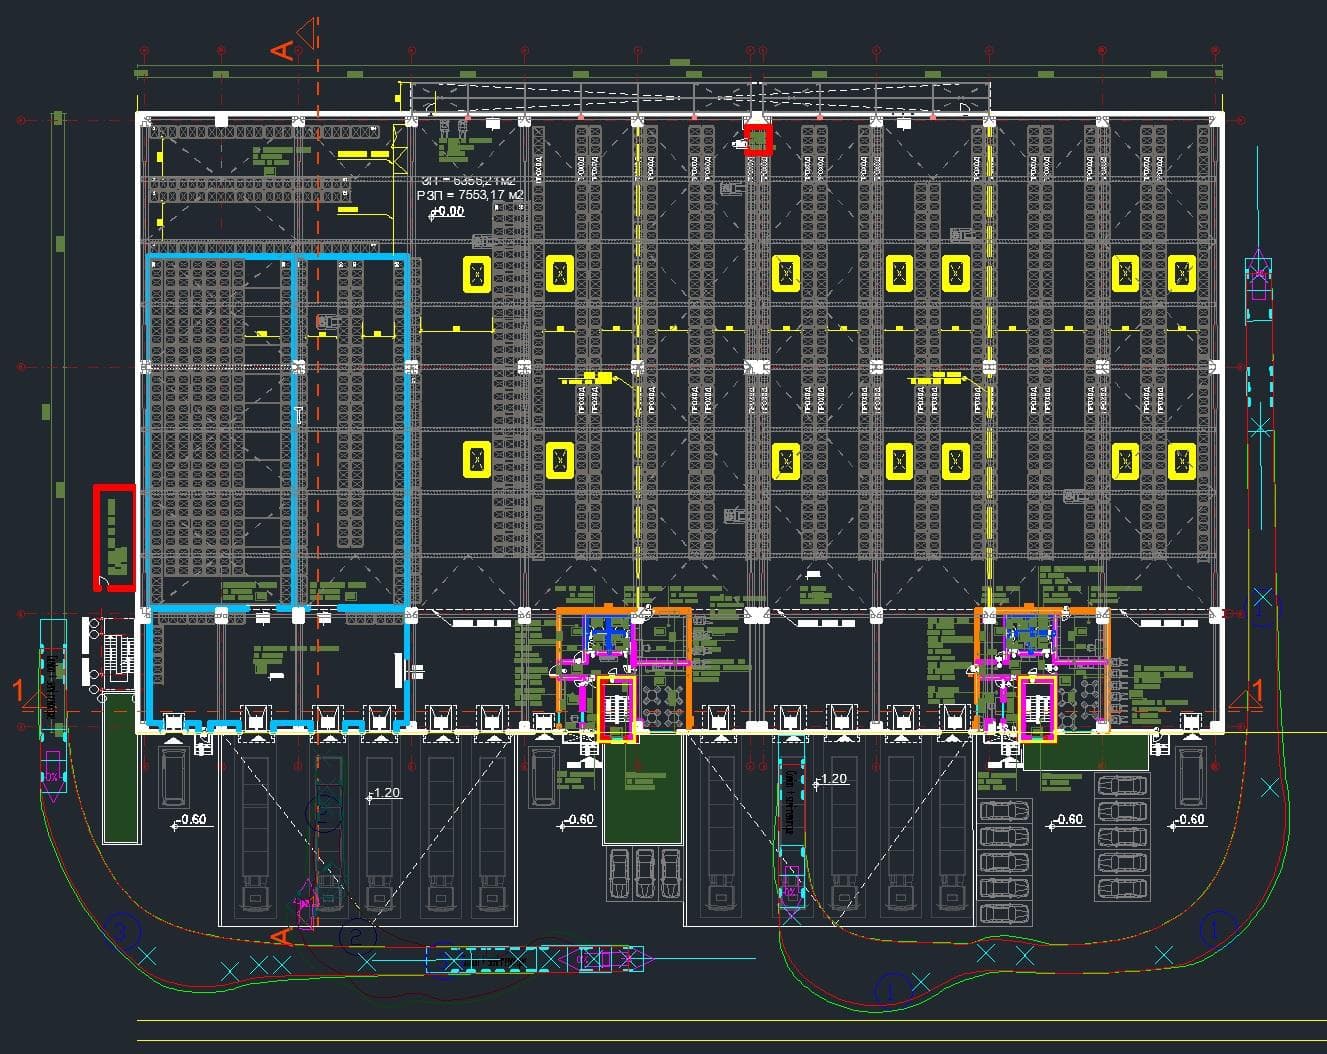
Layout alternatives modeled against the same demand, with travel and congestion compared.
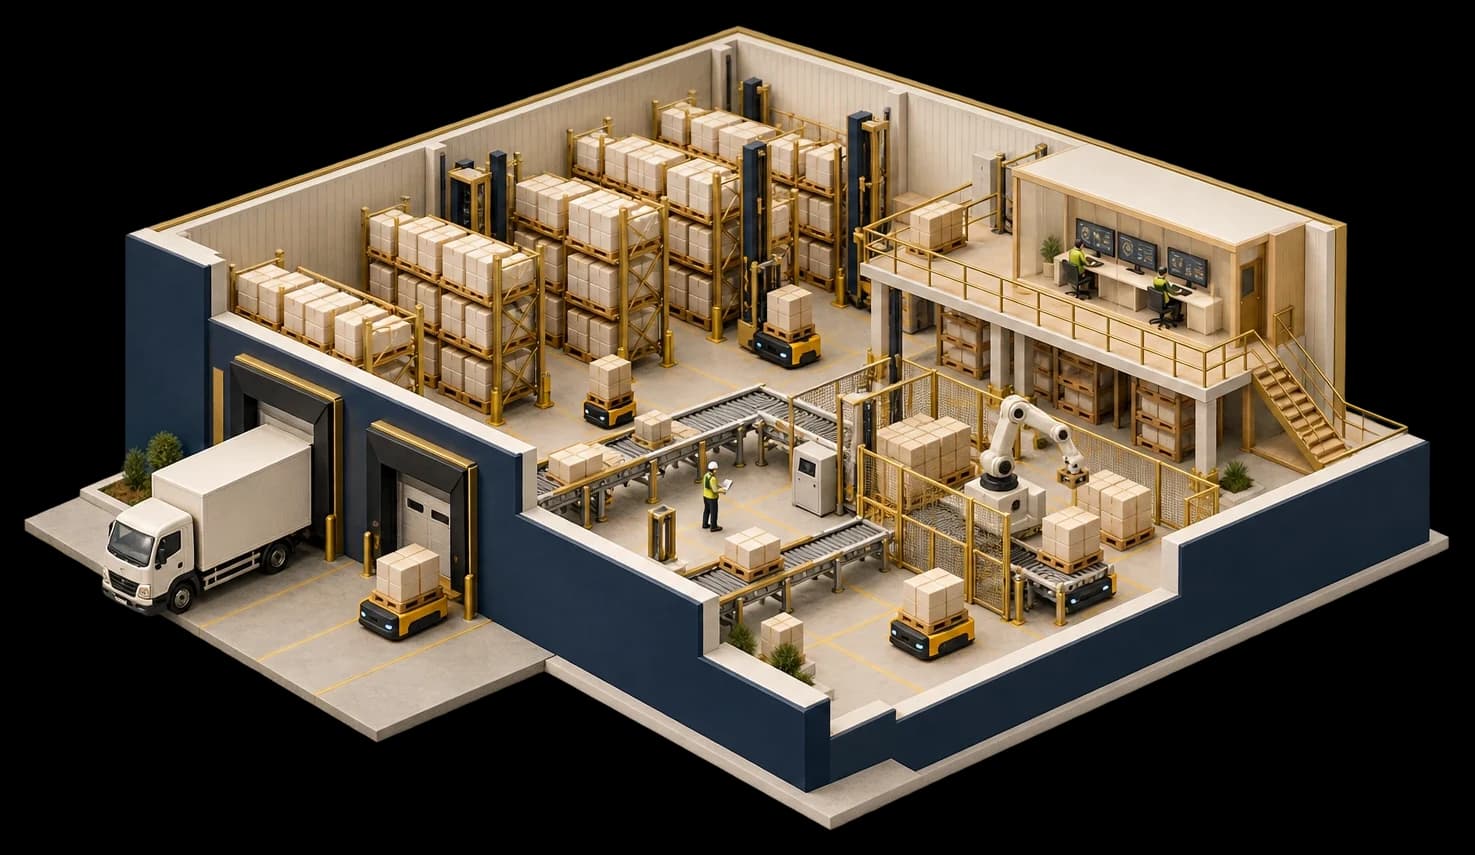
Visual models that let operations, finance and suppliers see each option and challenge it.
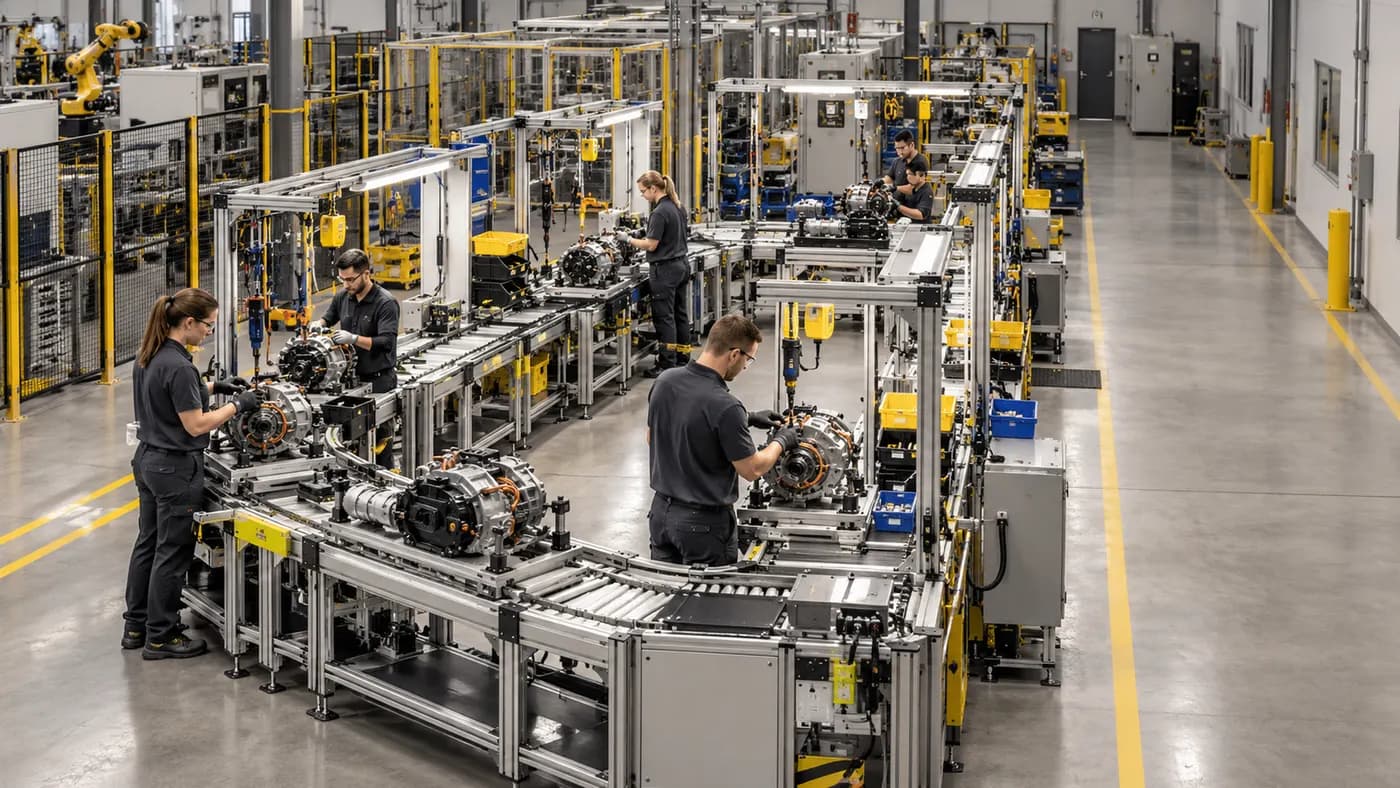
A plain record of what the model includes, what it leaves out and which inputs move the answer.
A recommendation, the pilot that would confirm it and the measures for comparing live results with the model.
Scope is agreed during assessment and sized to the decision. Automation integration is carried out alongside specialist equipment vendors and software providers.
How we track results
Elapsed time from released transport request to confirmed delivery; separate dispatch delay, travel and handover.
Completed transfers per defined period, alongside demand, item mix and constraints.
Busy equipment time divided by available resource time; separate productive travel, return and waiting.
Open tasks and elapsed waiting before service. Record queue age as well as queue size.
Observed operator hours across pickup, transport, handover and exception recovery; do not assume all work disappears.
Required deliveries completed within their agreed operating window; validate timing with downstream teams.
Actual baselines, observation periods, acceptance criteria and improvement targets are established during assessment.
[ Questions buyers ask ]
Test it before you buy it. We model your orders, layout and staffing, then compare the automation option with improving the current process under normal and peak demand, so the decision rests on throughput and utilization rather than a vendor's pitch.
A computer model of your warehouse that behaves like the real one: orders arrive, people and equipment move, and queues form. We build process and layout models in AnyLogic and robotics and AMR fleet scenarios in NVIDIA Isaac Sim, then use them to test changes safely.
Simulation answers this by running your real order profile through different fleet sizes and showing utilization, congestion and throughput for each, including at peak. You see the point where adding more units stops paying off.
Order lines over time, item data, the layout, process times, and staffing and shift patterns. Where data is missing we state the assumption openly in the model, so you know how far to trust each result.
It is when a decision is expensive to reverse: a new layout, a relocation, a peak staffing model or an automation purchase. For smaller changes we will tell you if a simpler analysis will do.
Start here
Tell us what you’re deciding: a layout, a staffing model, a peak plan or an automation investment. We’ll tell you whether modeling would help and what it would take.