Storage
- Racking utilization by zone, location type and level
- Storage density and use of available cube
- Equipment access to locations
Is our installed infrastructure used effectively against real demand?
An audit of how well installed racking, docks, aisles and material-handling equipment support real operating demand. We measure utilization, map the bottlenecks and show where reconfiguration can release capacity before you invest in more.
On site in Hyderabad, across Telangana and India. All our services in Hyderabad →
Service overview
Before adding space, racking or equipment.
Primary output: Utilization and capacity gap analysis.
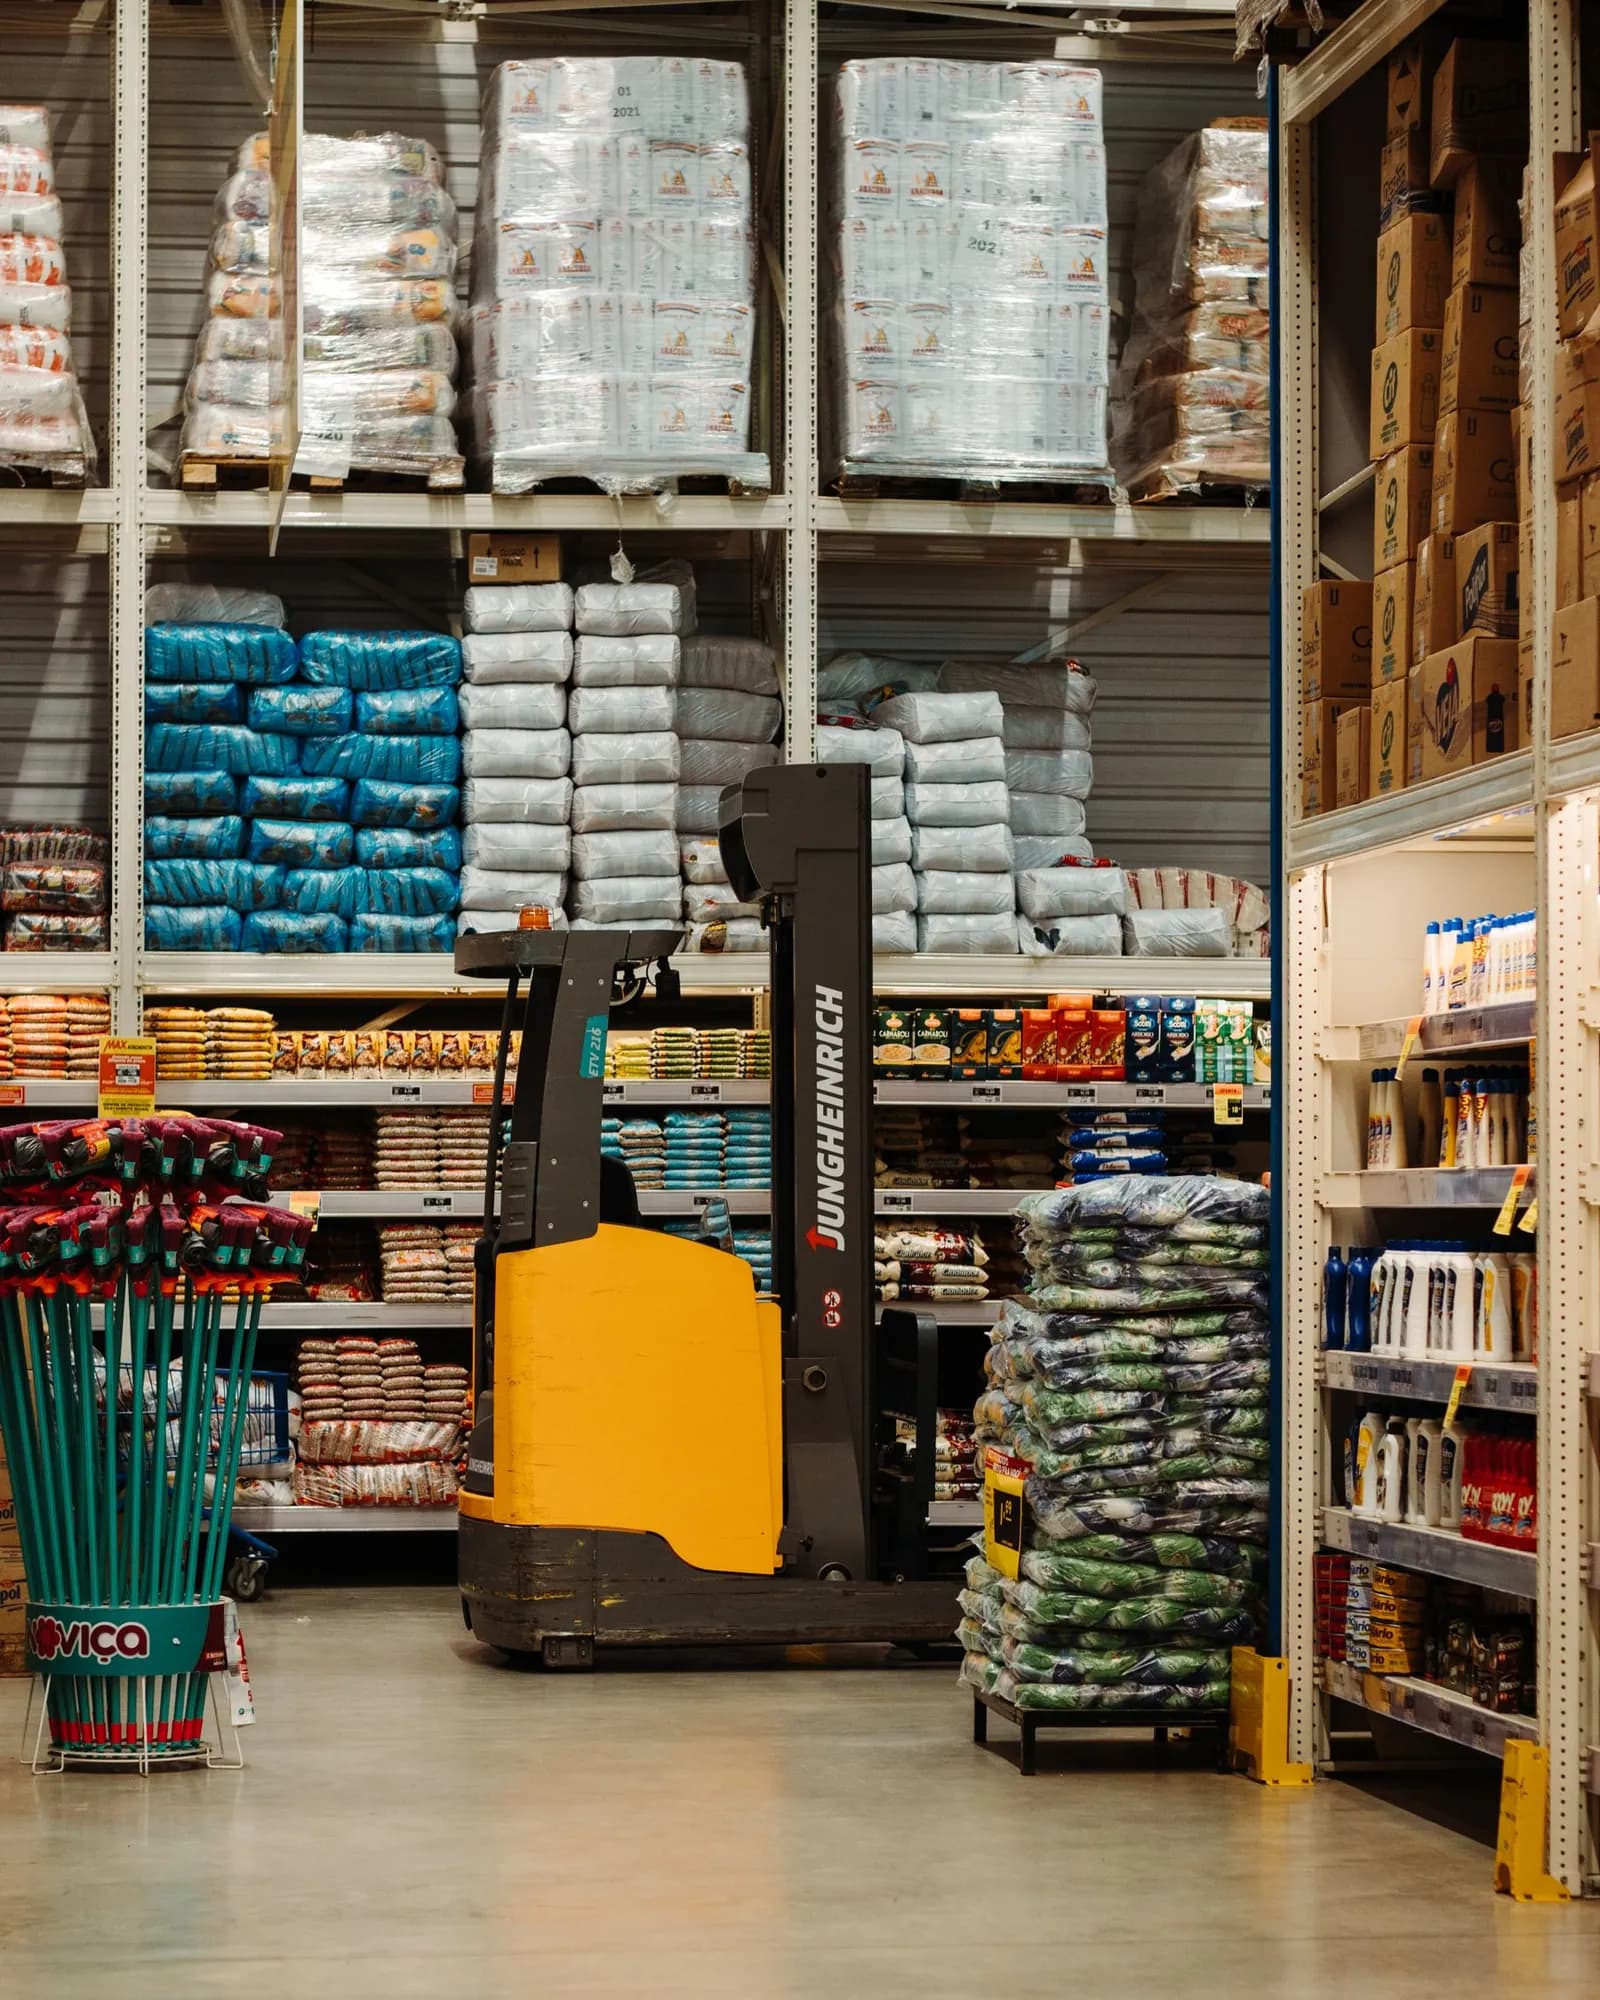
A warehouse can look full while many locations hold part pallets, slow movers sit in prime faces and fast movers are stored far from dispatch. Docks queue at peak and stand idle for hours. Forklifts are scarce at 10 a.m. and parked by 3 p.m.
Before adding space, racking or equipment, it pays to know how the existing assets perform against the demand they serve. Often the constraint is configuration and allocation, not capacity.
A4 / Assessment scope
Performance in use: how effectively the infrastructure you already have serves the demand placed on it. Scored against Part 4 of the TvastrOps Warehouse Standards (8 criteria) →
Technical approach
Requirements, observations and evidence are reviewed together before recommendations are prioritized.
Volumes by hour, day and season, order and receipt profiles, and expected growth.
Location occupancy snapshots, dock logs, equipment observation or telematics where available, and travel measurement.
Overlay utilization on the layout to see where capacity is consumed, congested or idle.
Compare reconfiguration options such as re-slotting, resized locations, dock scheduling or fleet changes, with scenario models where the decision warrants it.
Prioritized reconfiguration opportunities, with the measures that will show whether they worked.
Applications & operating risks
You have the racking, docks and forklifts, yet storage feels full, docks queue and equipment is always busy or unavailable.
Deliverables
The agreed scope determines the final document set, level of detail and any specialist follow-up.
Measured utilization of storage, docks and equipment, by zone and time of day.
Installed capacity against average and peak demand, now and at forecast volumes.
Where congestion, queues or idle time originate, and why.
Changes to layout, slotting, dock use or fleet that could release capacity.
A prioritized list with the measures to verify each change after it is made.
Scope boundaries
Utilization and capacity findings rest on observation and the data available during the audit period. They describe operational performance, not structural or rated capacity. Rated load limits remain as specified by the racking and equipment manufacturers.
Vendor and MHE selection assistance. Requirements briefs, evaluation criteria and comparison of supplier proposals for racking, handling equipment and automation. We are independent of suppliers and do not resell equipment.
Storage feasibility studies. Concept storage layouts that estimate usable positions for a building, and show what limits them.
Post-improvement performance verification. Measuring the agreed KPIs after a change against the original baseline, so you know what actually improved.
[ Questions buyers ask ]
Often not yet. Many sites run out of usable space long before they run out of building: half-empty locations, beam heights that no longer match the pallets, fast movers in full pallet positions and unused height. The audit measures how much of your installed capacity is really used before you commit to more.
By zone, location type and level: occupied against available positions and use of the available cube, alongside dock use by hour and door and forklift utilization. We set all of it against your average and peak demand, so you see the real headroom.
We compare installed capacity with average and peak demand and project the headroom at your forecast volumes. You see which constraint arrives first, space, docks or equipment, and roughly when.
Sometimes the constraint is equipment, not people. We measure forklift availability and idle time, dock use by hour, aisle congestion and crossing points, and separate infrastructure bottlenecks from staffing ones.
Measured utilization of storage, docks and equipment by zone and time of day, a gap analysis of capacity against demand now and at forecast volumes, and the reconfiguration options that release capacity before you invest in more.
Start here
Share the building or operating issue, available drawings and the decision you need to make. We’ll agree the assessment scope and useful outputs.